
React native is a good choice to write cross platform mobile application. Testing and debugging react native applications locally is also quite straightforward.
Once we deploy these applications, we definitely want to know how our users is using our application. For web applications, most of the time we are defaulting to google analytics. However, for react native application running on mobile, google analytics might not work very well.
For some time now, I have been using Fabric to understand user’s behaviour in my react native backed mobile applications. As a bonus, on top of being able to send out user’s behaviour, Fabric’s core is its’ Crashlytics framework which gives you a quick view when there are crashes in your application!
Side Note: Fabric was acquired by google and will be working closely with the Firebase team. Really looking forward to the point where google analytics and fabric is merged for mobile devices!
Let’s walk through some of the useful setups to do in your Fabric enabled react native applications.
Fabric installation
First, you would need to setup fabric in your react native project by following the steps outlined in:
- iOS – install CocoaPods in react native for an easier time and follow https://fabric.io/kits/ios/crashlytics/install
- Android – https://fabric.io/kits/android/crashlytics/install
Once done, we will get the excellent package react-native-fabric
react-native install react-native-fabric
Tracking users in Crashlytics and Answers
In order to get meaningful data, we would want to track user ID or username in our react native application.
Once you have fabric and react-native-fabric installed, adding user ID and username for tracking is a breeze.
To test out our fabric installation, let’s add a custom user name, id, and email in index file. For testing purpose, add these codes in during componentDidMount in your preferred platform index files (index.<platform>.js).
| import React, { Component } from 'react'; | |
| import { | |
| AppRegistry, | |
| StyleSheet, | |
| Text, | |
| View | |
| } from 'react-native'; | |
| import { Crashlytics } from 'react-native-fabric'; //Get Crashlytics component | |
| export default class FabricAnalytics extends Component { | |
| componentDidMount(){ | |
| //Sets user details | |
| Crashlytics.setUserName('megaman'); | |
| Crashlytics.setUserEmail('[email protected]'); | |
| Crashlytics.setUserIdentifier('1234'); | |
| } | |
| render() { | |
| return ( | |
| <View style={styles.container}> | |
| <Text style={styles.text}> | |
| React native fabric | |
| </Text> | |
| </View> | |
| ); | |
| } | |
| } | |
| const styles = StyleSheet.create({ | |
| container: { | |
| flex: 1, | |
| justifyContent: 'center', | |
| alignItems: 'center', | |
| backgroundColor: '#F5FCFF', | |
| }, | |
| text: { | |
| fontSize: 20, | |
| textAlign: 'center', | |
| margin: 10, | |
| } | |
| }); | |
| AppRegistry.registerComponent('FabricAnalytics', () => FabricAnalytics); |
Ideally the code is added right after user is logged in. In the case where app is closed and re-opened, we would want to re-assign user ID and username once the app is ready to ensure that crashlytics gets the latest user information.
With crashlytics installed, we automatically get a crash/error notification immediately.
Getting user behaviours
Since we want to get the analytical capability of fabric as well, we would then need to enable Fabric’s Answer. react-native-fabric already have answers bundled with the package. All we need to do is to enable Answer from Fabric dashboard.
The very basic analytics that we would definitely want to gather is scenes/routes movement that is triggered by our users.
In the case of navigation, be it react-navigator or react-native-router-flux, we can setup a middleware in redux or manually add an interceptor on scene change.
However, to test out whether our Answers installation works well, we can simulate an event by adding a call to Answers on componentDidMount again.
| ... | |
| import { Crashlytics, Answers } from 'react-native-fabric'; //Add Answers | |
| export default class FabricAnalytics extends Component { | |
| componentDidMount(){ | |
| ... | |
| //Additional answers | |
| Answers.logContentView('To Do 1', 'To-Do', 'to-do-42'); | |
| Answers.logContentView('To Do 2', 'To-Do', 'to-do-42'); | |
| } | |
| ... | |
| } |
Simulating a crash
Lastly, we would love to see what actually happens when our application crashes on user’s devices and whether the user setup that we’ve done earlier is sending the correct events.
Go ahead and add a crash simulation in your componentDidMount once again
| export default class FabricAnalytics extends Component { | |
| componentDidMount(){ | |
| ... | |
| setTimeout(()=> Crashlytics.crash(), 5000); //simulates a crash after 5 seconds | |
| } | |
| ... | |
| } |
Enjoying the result!
With Crashlytics and Answer setup as above, it’s time to enjoy the result of our Fabric setup.
Go ahead, build your app in release mode and kick off your simulator. This should result in application starting, sending events to Fabric and crashes after 5 seconds
Note: Your app must be in release mode, debug mode will deny Fabric from sending answers event.
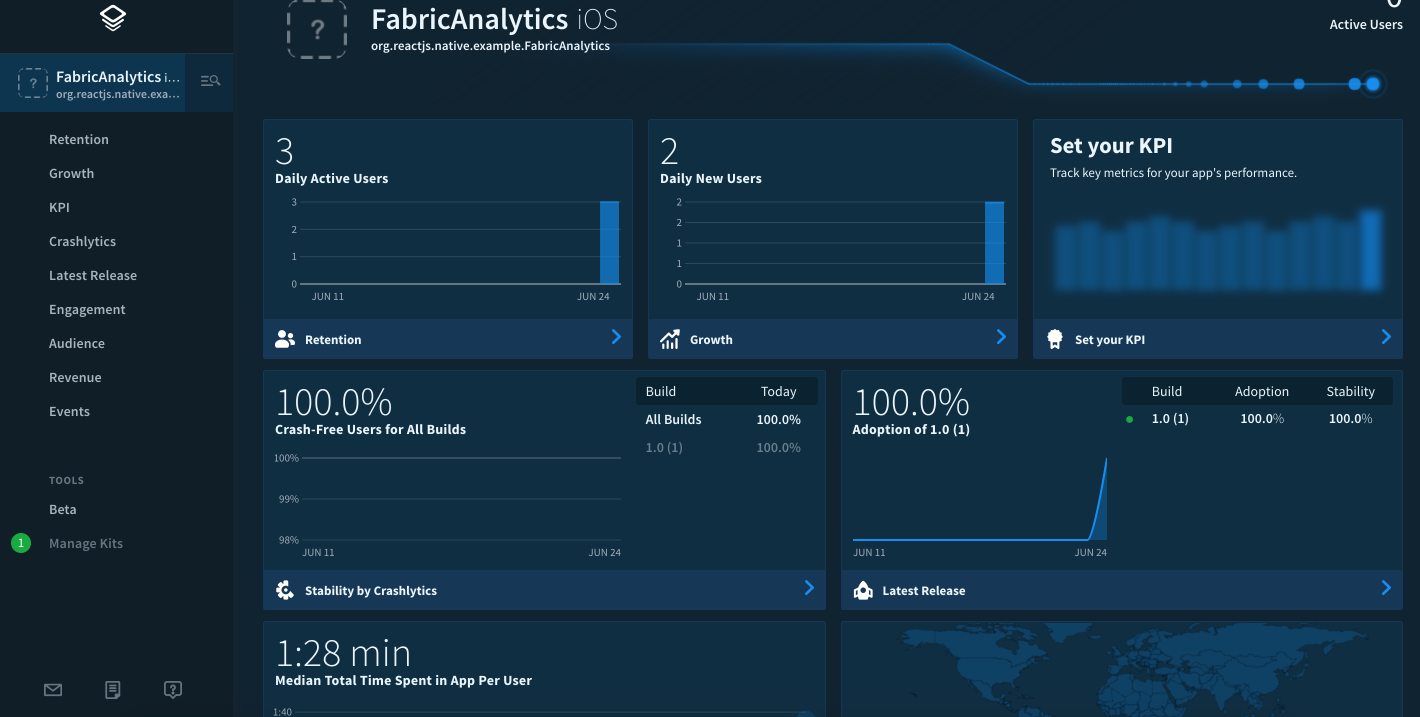
The dashboard
Once you’ve run your app, you will be able to see a functioning dashboard
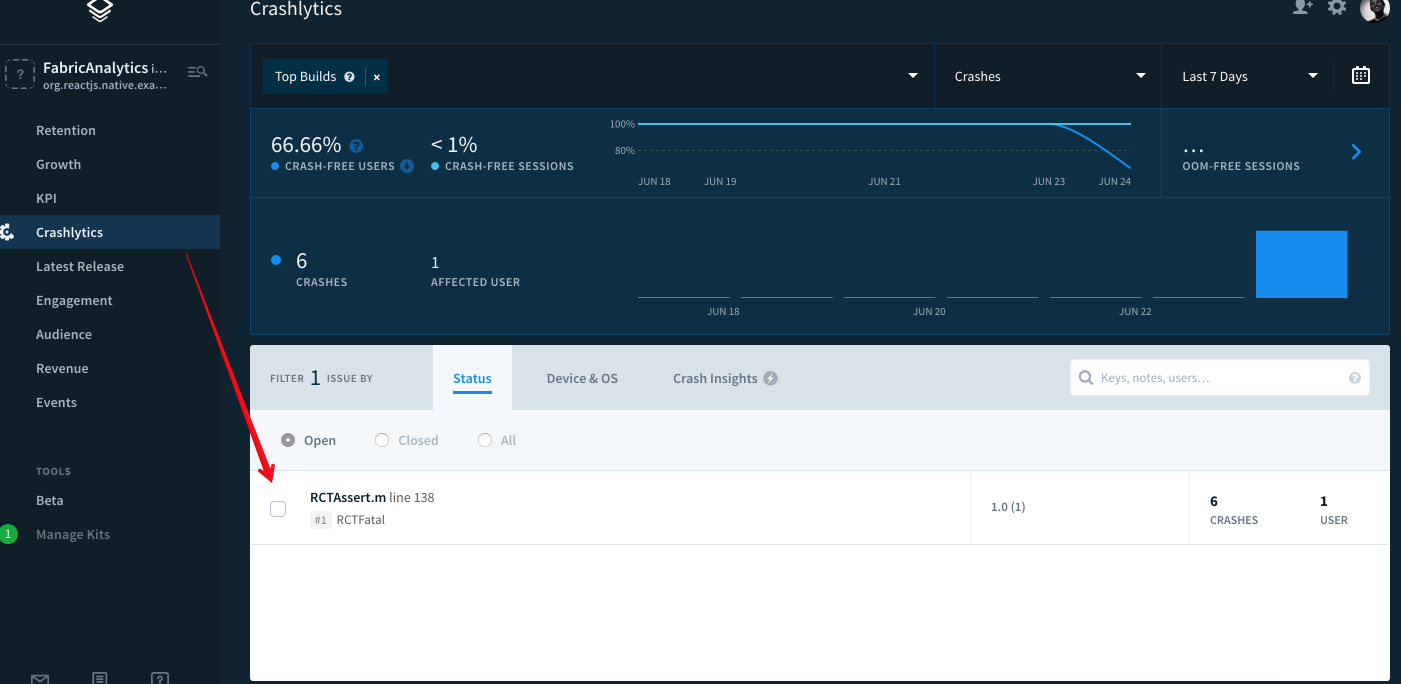
Crashlytics crash with user details
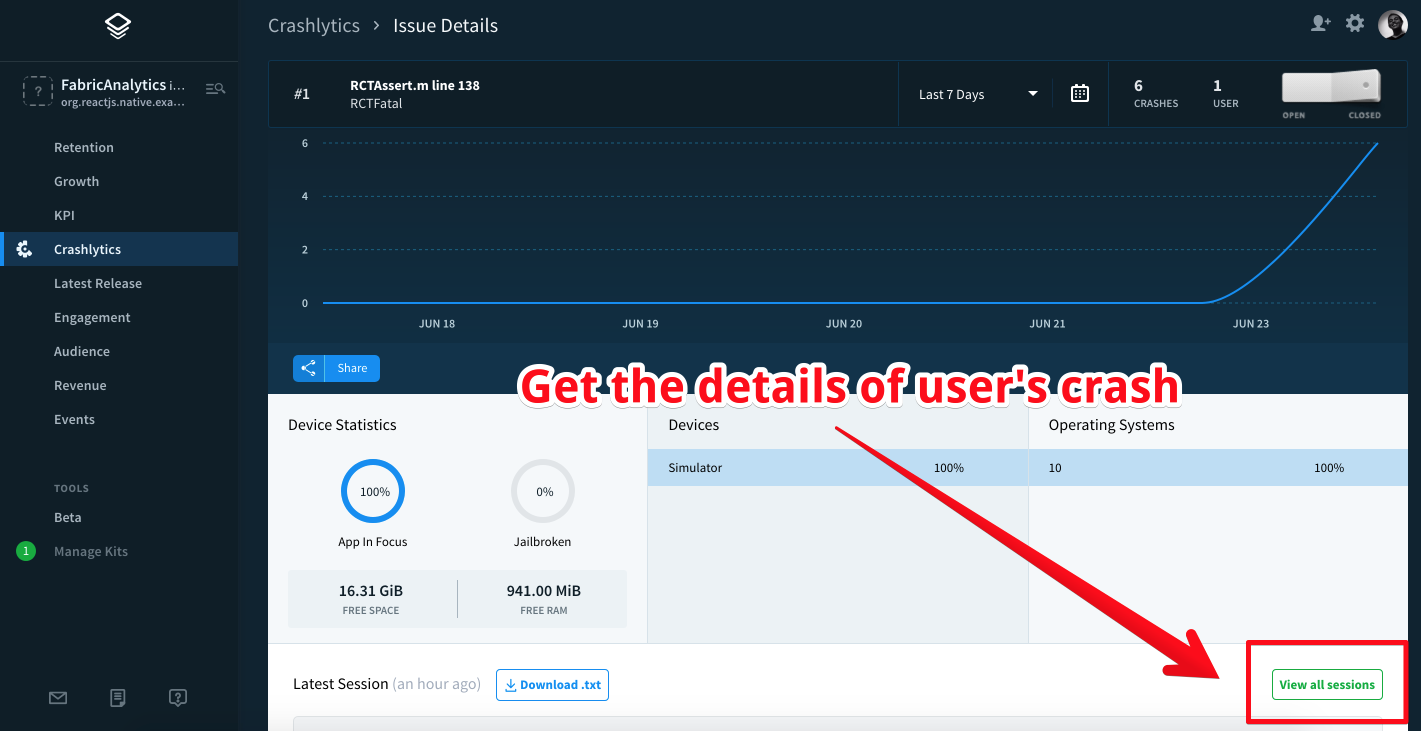
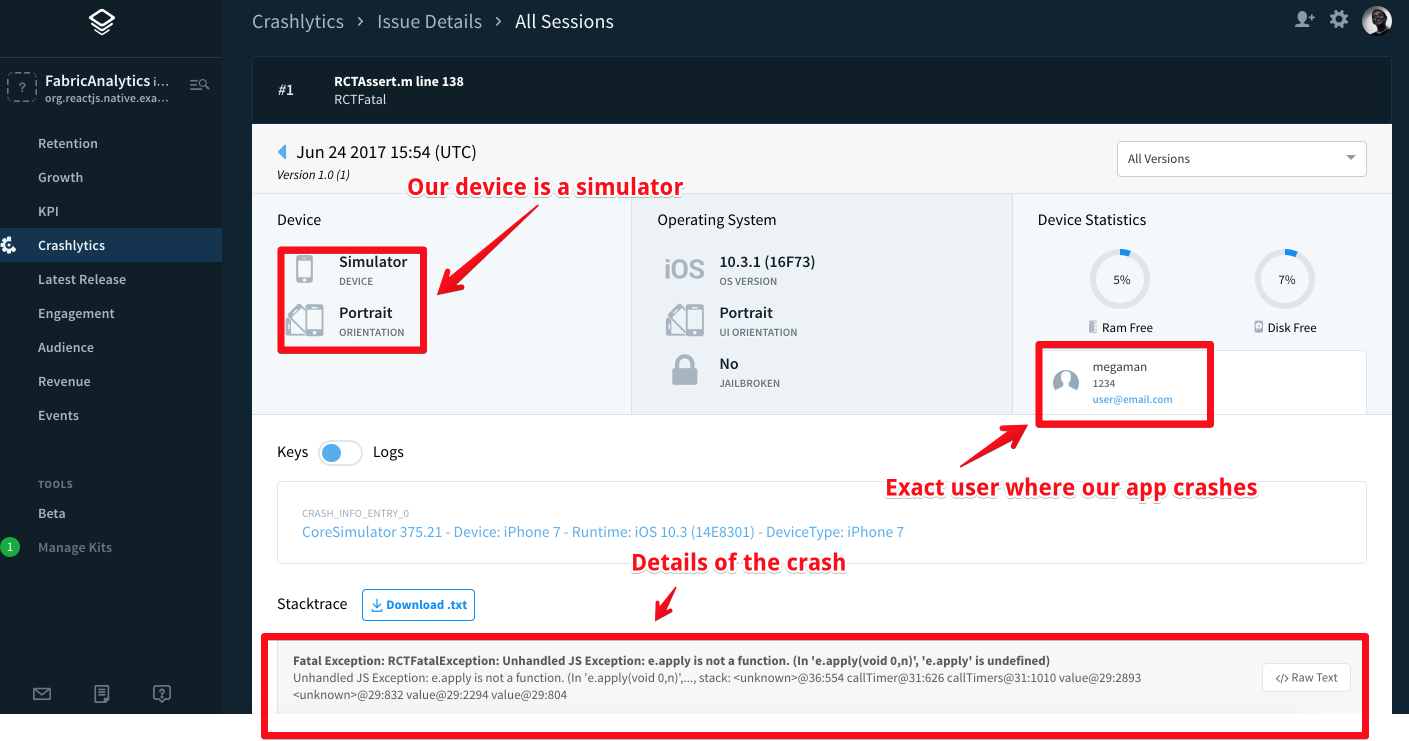
To get a good look at how the crash is reported, we would need to open the crashlytics menu in Fabric dashboard, pick the issue and have a look at the session. The session will show you exactly who is getting affected!
Here’s a how fabric reports the person who got affected by a crash.
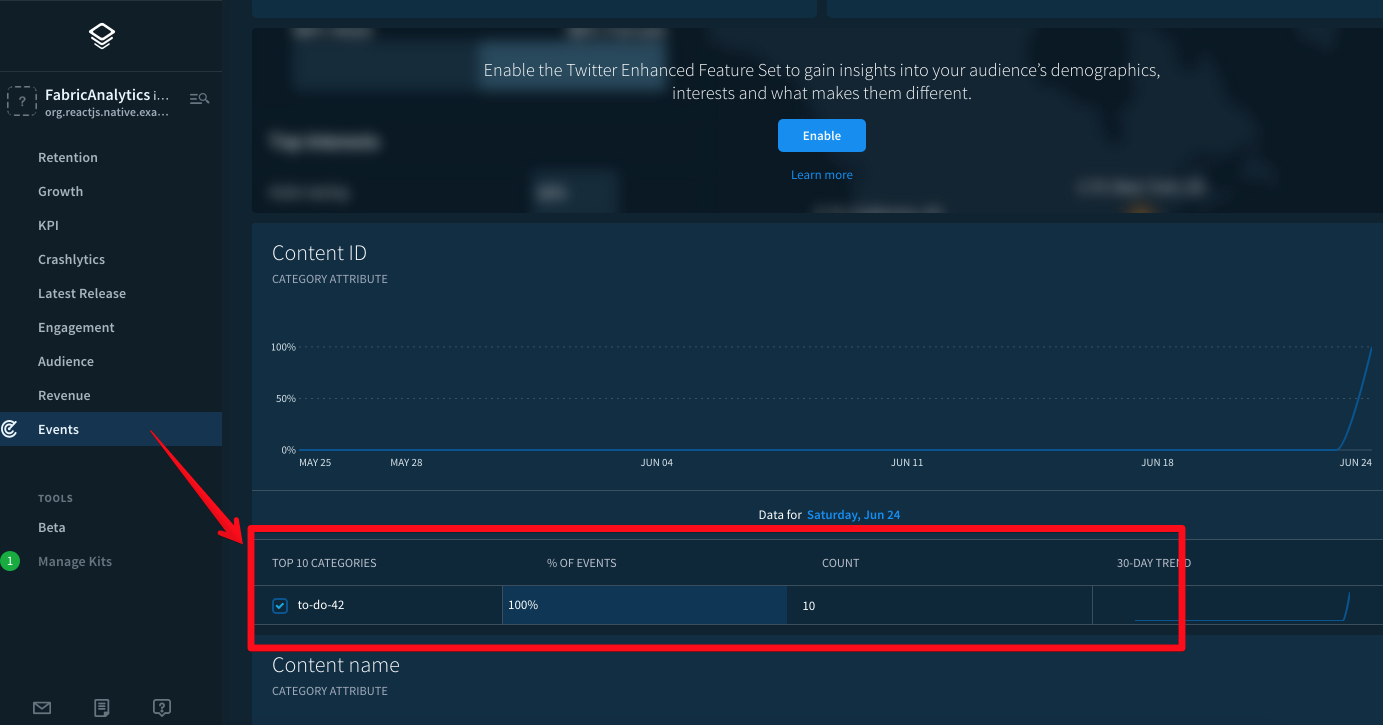
Analytics on Answers
With answers enabled and sending events, we can drill down to the events that Fabric receives.
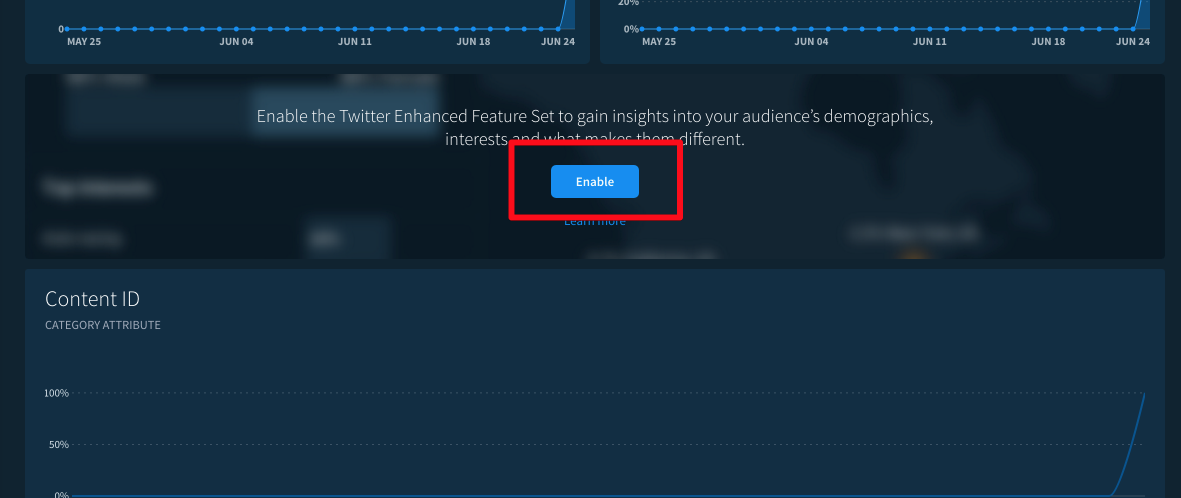
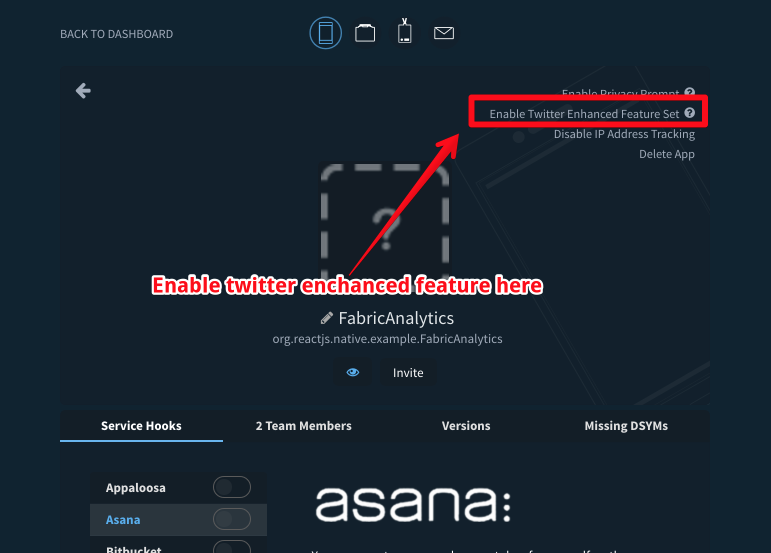
As a bonus, if you enable Twitter enhanced feature set, you can get the demography of your users. How convenient!
Fabric setup should set us far ahead in understanding our user’s behaviour in react-native app!
Do you know of better tools to get analytical insight in mobile application built with react native? Share in the comment if you do 😉